Venn Diagram Generator
This is a tool for exploring Venn diagrams. It is based on the official tool provided by The School of Informatics.
Heads up! Only WebKit based browsers (Chrome, Safari, Opera, etc) are supported.
Instructions
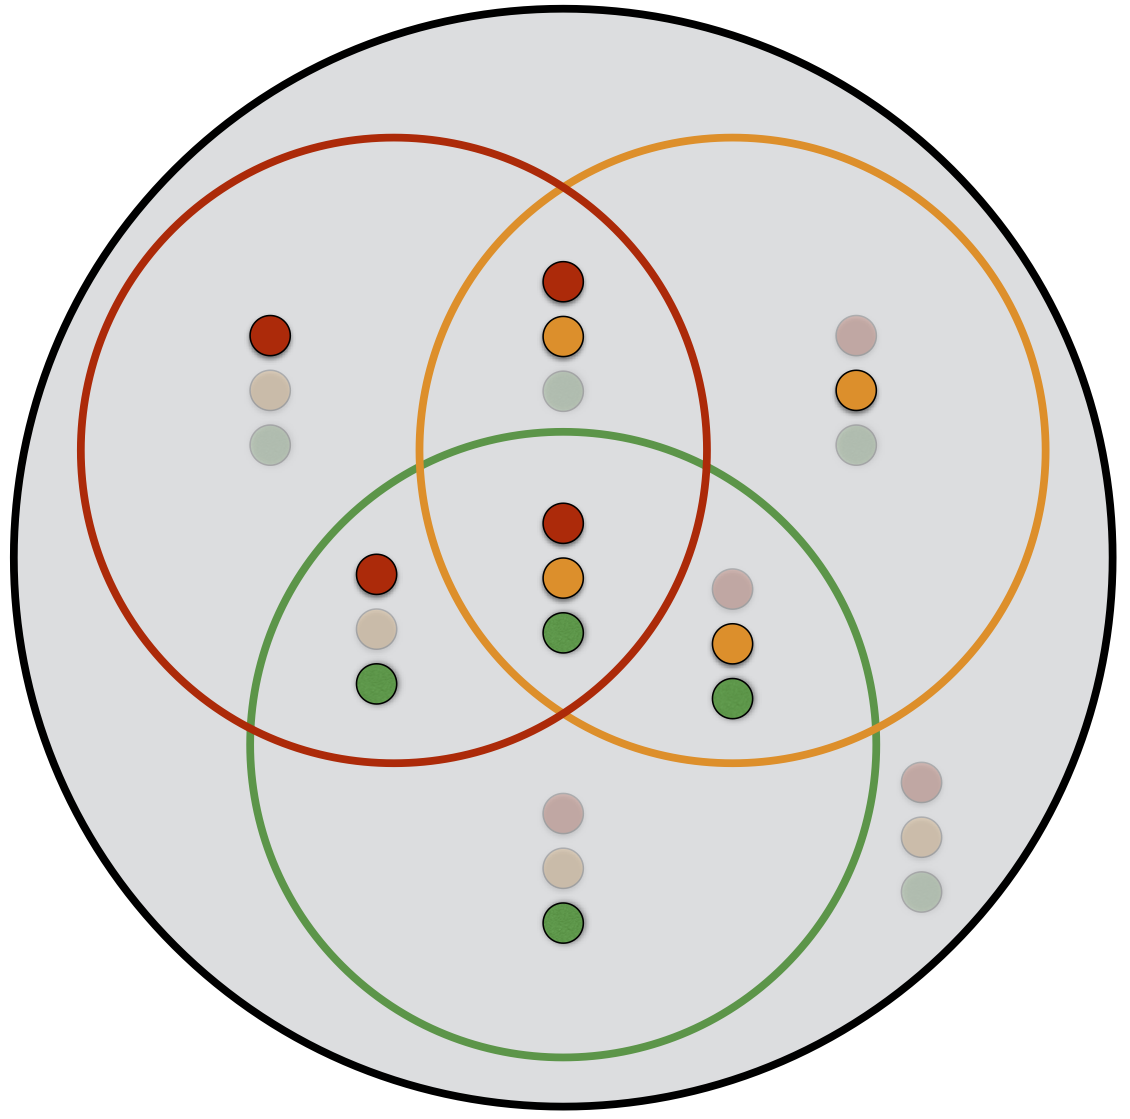
This diagram shows the state represented by each region.
Your boolean expression is parsed as JavaScript, and so must be written in valid JS syntax. However, to make things convenient, words like "AND" are automatically converted to the JavaScript equivalents.
Here's a quick overview (note, lowercase equivalents are valid):- The three propositional letters: R A G (may also be written as "red", etc.)
- ∨: or ||
- ∧: and &&
- ¬: not !
- T: true 1 T
- ⊥: false 0 F
- ⊕: xor ^
- ↔ (if and only if): iff ==
-
The
ternary operator
A ? B : Cessentially representsif A then B else C